
In both my previous ‘Eurovision Song Contest Voting‘ and ‘History of Refugee Movement‘ blogs, I have needed to denormalise datasets in order to properly use them within Tableau. If you want to replicate a similar action on a large data set, here’s how I did it…
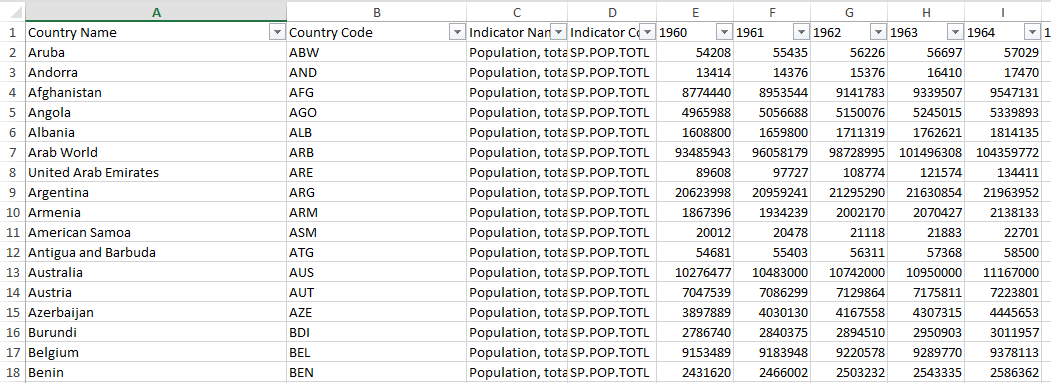
For this tutorial I’ll use the World Population dataset, which can be found at the World Bank data bank. The data is presented in a way that each country/region has all the population data on one row, like this:
I want to be able to select a distinct population value for a specific year, and as such need to denormalise the data in order to turn the columns to rows, like this:
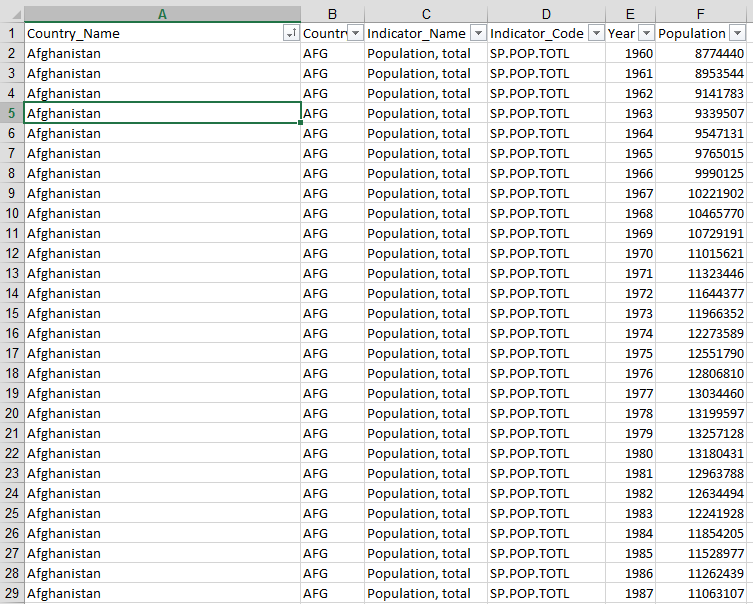
I have pivoted the data, based on the year and now the population for each year is presented on an individual row.
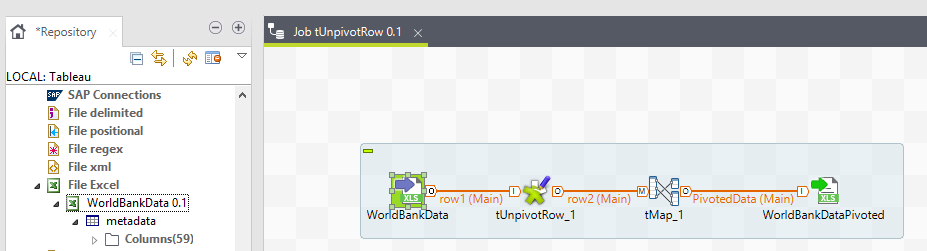
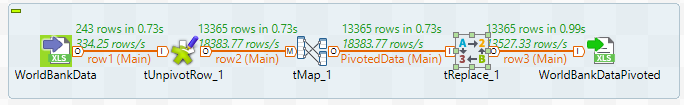
The Talend job to do this couldn’t be simpler: tFileInputExcel -> tUnpivotRow -> tMap -> tFileOutputExcel.
The Input Component
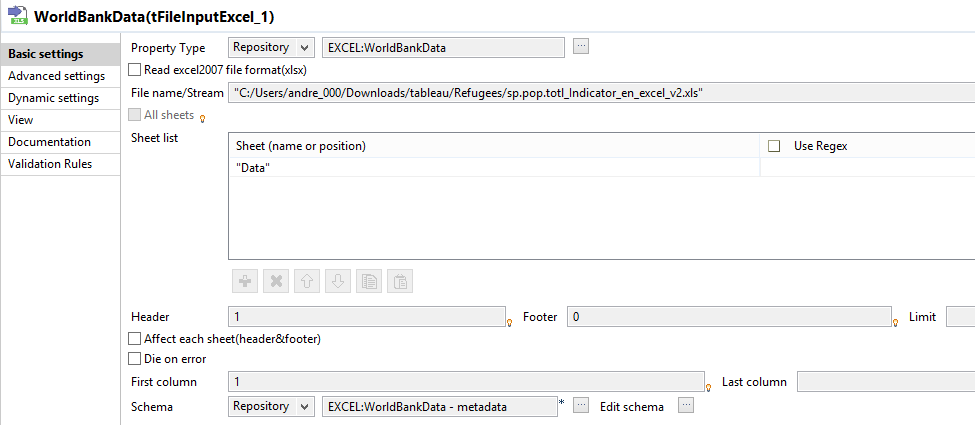
Nothing fancy in here, and it’s using the Repository context I set up by having Talend fetch the schema from the input file. It’s important to note that Talend doesn’t like column headers beginning with an integer, so it changes 1960 to “_960”, but not to worry as we can fix that later on within the Talend job.
The tUnpivotRow component
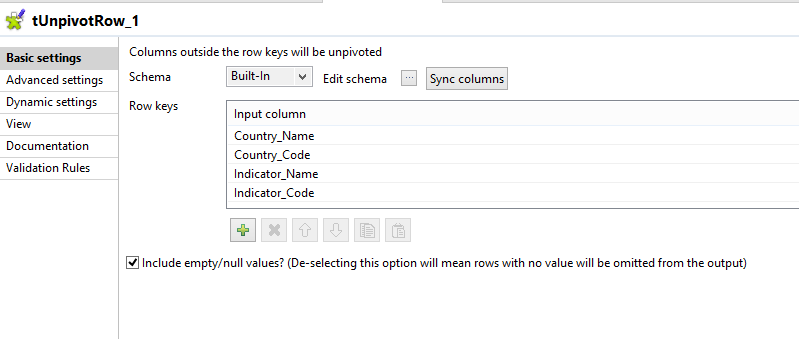
The reason we’re here. Here we define which columns NOT to pivot. In the World Bank data file, the first four columns will be duplicated for each unpivoted row which we define in the schema like this:
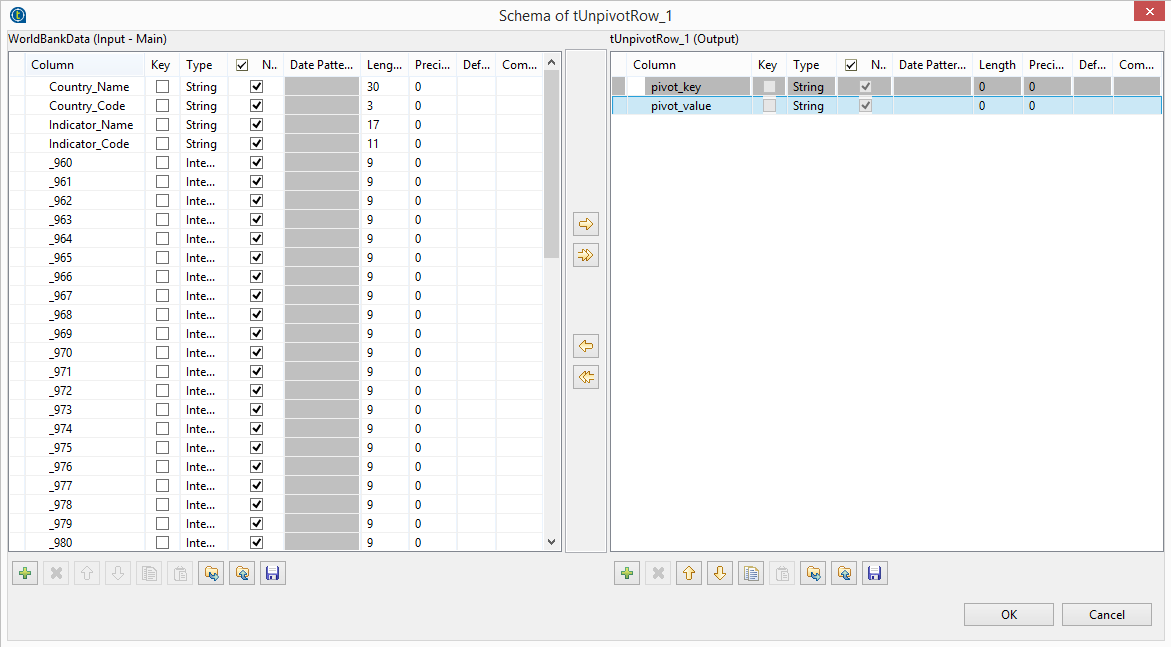
Click Edit schema in the tUnpivotRow component. On the left hand side is the input file schema, on the right is the pivoted schema. In the current state we would lose the information from the first four columns as they are to be excluded from the unpivoting process, so let’s add them to the output schema like this:

pivot_key is the column header and the pivot_value is each row with a value in that column. So, column _960 will become x amount of rows, depending on how many values (population numbers in this case) are in that column.
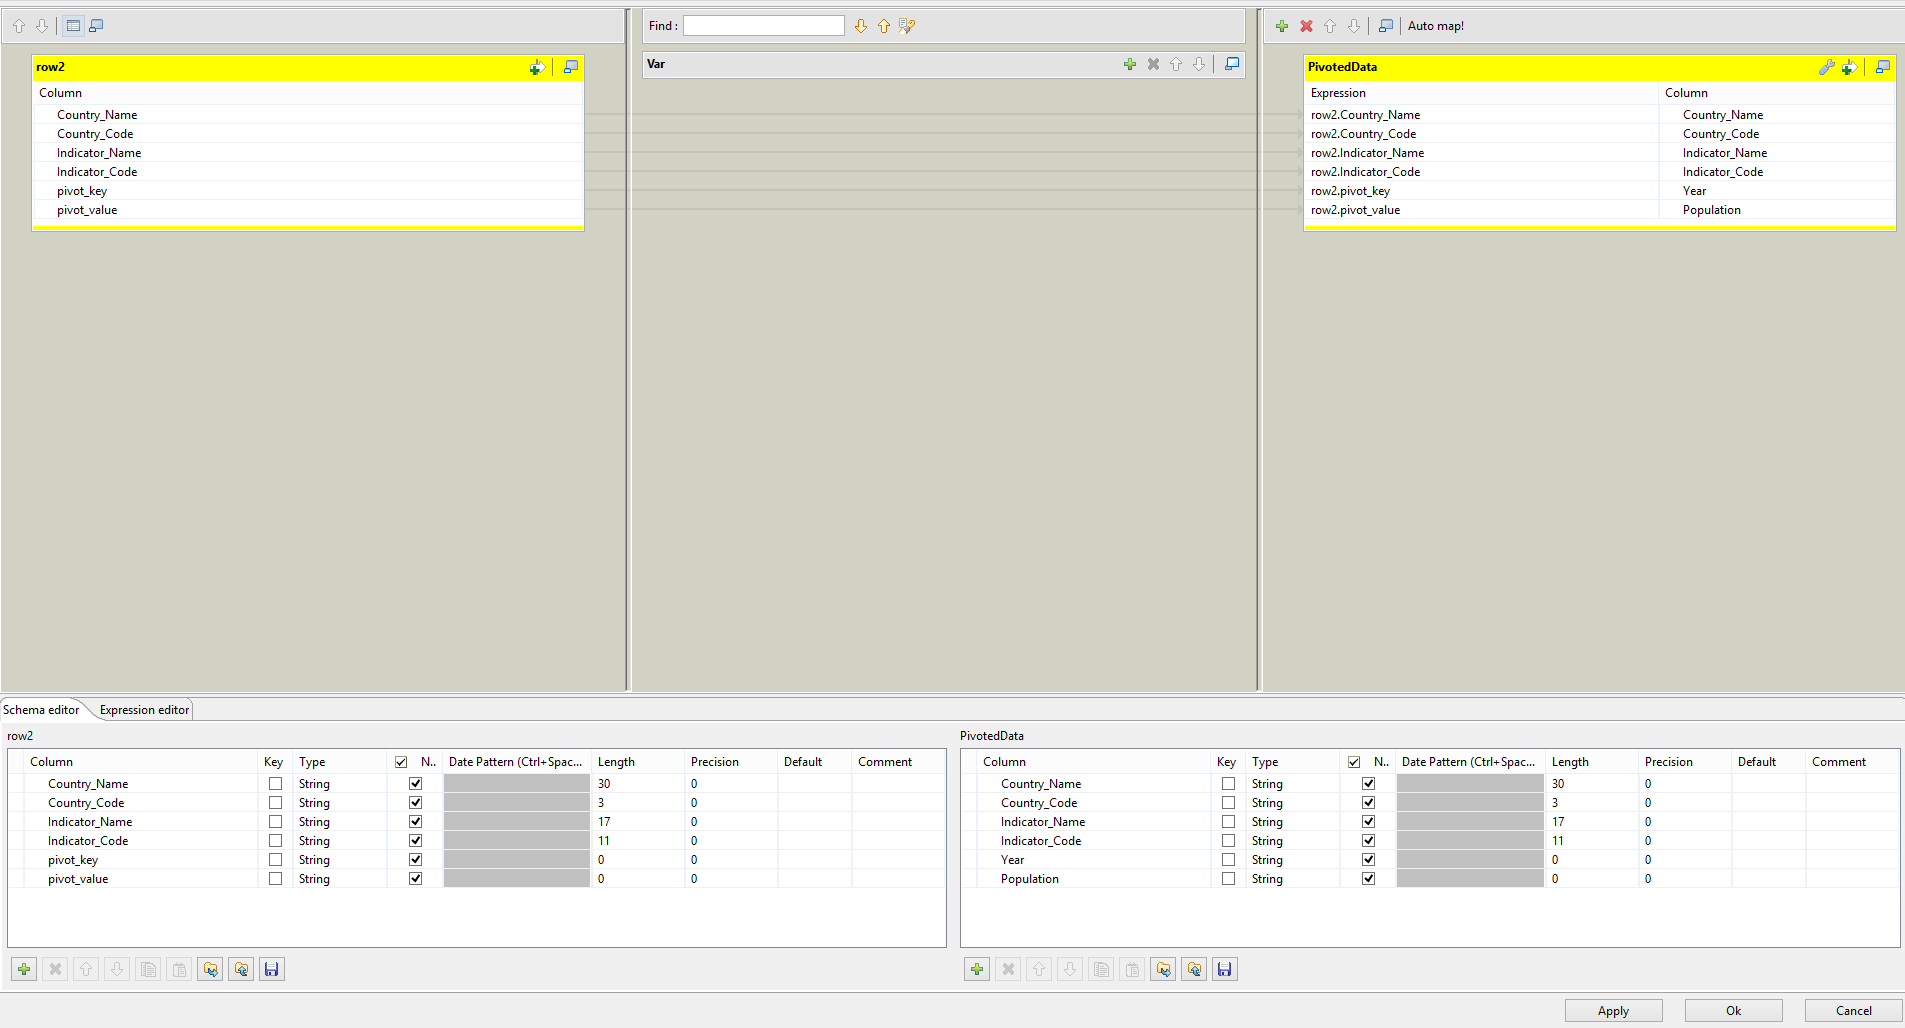
The tMap takes all the prior information and feeds it through to an output, where we’ve defined the pivot headers as Year and Population. Note that tUnpivotRow converts all its columns to String type, so you’ll need to convert types either in the tMap or by using a tConvertType component later on.
Feed all that into a tFileOutputExcel file and we will have a dataset that can be better used in reporting. If we want to replace the _960 to a proper 1960, use a tReplace component like this:
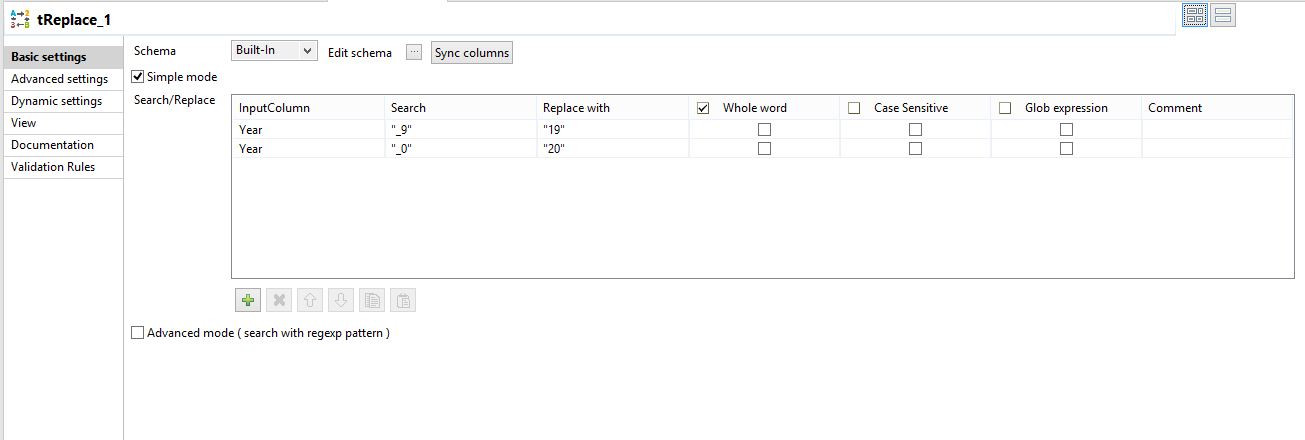
Run the job and in this case, we have converted population values based on 243 distinctions into 13365 rows.
As I noted earlier, I used this approach to denormalise datasets for my two other blogs about Eurovision Song Contest Voting and ‘History of Refugee Movements’.
You can download the tUnpivotRow component from the Talend Exchange, and follow instructions on how to install it in Talend here.
0 Comments
Trackbacks/Pingbacks