
Overview
Data quality plays a vital role in data driven organisations; the ever-growing reliance on data to make critical decisions based on predictive analysis and trends relies heavily on trusted data. Most organisations want to capitalise on the data they have already stored from their clients, suppliers, internal departments (such as finance, HR, etc.) and create consolidated views of these data sources to measure performance and trends within their organisation. The journey to achieve this is a tough one, especially given the restrictions of and imposed by IT departments and the potential difficulties faced during extraction/connection to various data sources.
This blog will cover an introduction to Data Quality as an activity that can mitigate business users’ reliance on the IT team.
What is Data Quality and why is it important?
All of us, irrespective of what field we are in, have encountered issues with understanding or even relying on data. For example, a finance report created by person A may be different to that of person B because of reasons such as connecting to a different data source or using a different business rule to aggregate the data. Organisations can then face reconciliation discrepancies and invest a huge amount of time to retrace and spot the issues. In order to rely on data that is ‘fit for purpose’ for its use in operations, decision making or planning business end users ought to always be able to trust the quality of the data. Unfortunately, this is rarely the case. This blog will demonstrate how a data quality audit can alleviate these data quality issues by discovering, profiling and automating cleansing data activities.
Data Profiling
Profiling data is an important step in assuring high data quality because it is imperative that you first and foremost, understand your data. This particular blog is the first in a series about data quality. It will cover the basics of how to set up profiles against columns and set up business rules and requirements. This will enable you to later analyse the data by cross-referencing the relevant columns and therefore cleanse the data accordingly. I shall begin by introducing a simple statistical analysis on a database comprised of Server configuration data (an example report that is captured by IT service providers reporting to clients). In order to run this data profiling activity, you will require:
- A free version of Talend Open Studio for Data Quality. This is available at: www.talend.com
- A connection to an existing MySQL or any other Database or CSV file.
The Talend Software
Talend is an open source software that can connect to various data sources and is used in Data Integration, Data Quality, Big Data, Master Data Management and ESB processes. In this exercise we will be using Talend Studio for Data Quality. I have connected to a MySQL database in the Talend DQ Studio to read values, only. This makes it easier for an end user to gain access to the database without the threat of changing any data.
Connection Analysis
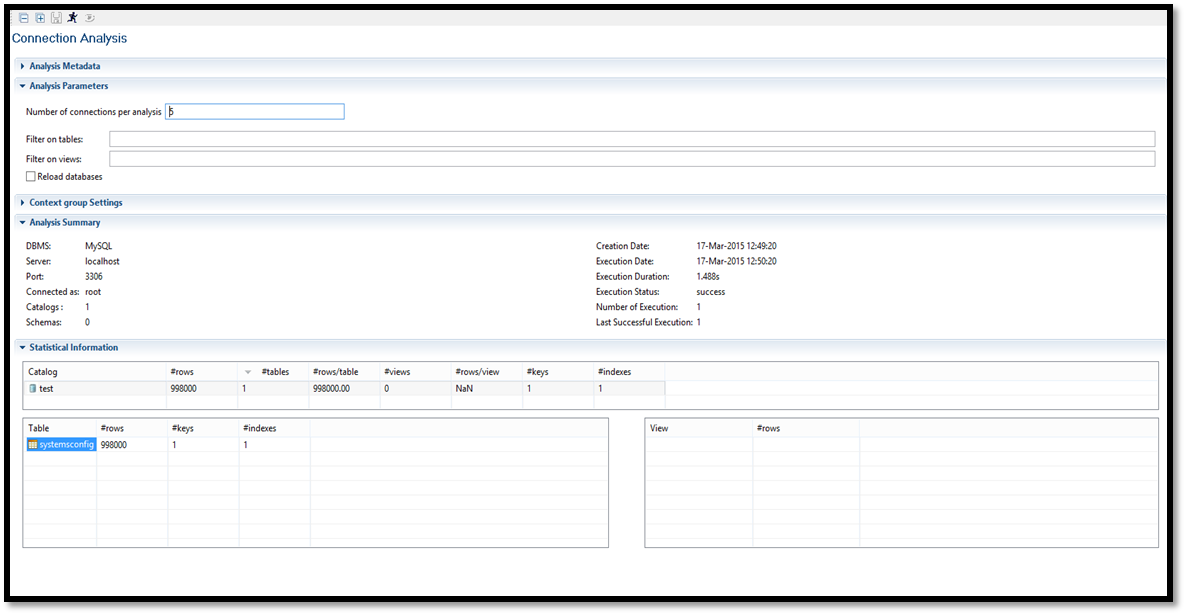
‘Connection Analysis’ analyses the total number of catalogues, tables, rows, keys, and indexes, therefore providing an overview of all your database contents. Below is a screen shot of the connection analysis as performed on the server configuration data stored in MySQL. As soon as you run the analysis, you will notice that there is one table in this database that has 998,000 rows of data and 1 key. Instead, imagine if you had a dozen or more tables in your database… Connection analysis helps you summarise all tables in your database as well as check basic information such as the number of rows or empty tables. You can also filter for specific tables in the ‘Analysis Parameters’ section.
Column Analysis
Single Column Analysis
‘Single Column Analysis’ performs basic checks on data validation such as addresses, postal codes, telephone numbers and/or custom pattern matches. It also allows you to select indicators for a number of null, unique, duplicate or blank data values for individual columns. For the purpose of this exercise, I have used a set of UDIs (user defined indicators) for all the columns in the table. Talend also provides a ‘Where’ section for any SQL queries in order to filter any data (allowing you to expel any irrelevant rows) before running the analysis. We will not be filtering or using the ‘Where’ clause for this particular analysis.
See below for the UDI configuration:
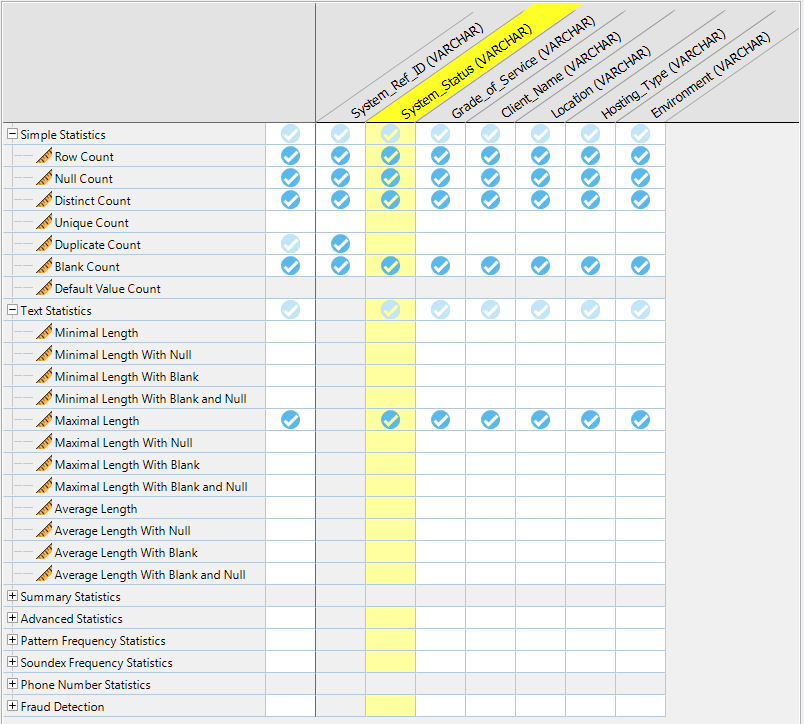
Based on this set of UDIs, I have created basic business guidelines for each column:
|
Column Name |
Type |
Guidelines |
|
System Ref ID |
Key (VARCHAR) |
Should always be unique |
|
System Status |
VARCHAR |
Should never be null. 2 Text Values: “Active” or “Inactive” only. |
|
Grade of Service |
VARCHAR |
Should never be null. 4 Text Values: “Grade A” “Grade B” “Grade C” “Grade D” |
|
Client Name |
VARCHAR |
Should not be null |
|
Location |
VARCHAR |
Should not be null |
|
Hosting Type |
VARCHAR |
Should not be null 4 Text values |
|
Environment |
VARCHAR |
Should not be null 2 text values |
The configuration is now set up and the column analysis can now be run.
Results and Analysis
The results of the column analysis will indicate which columns comply with the above guidelines and will help us further investigate and create profiles against each column.
System Ref ID
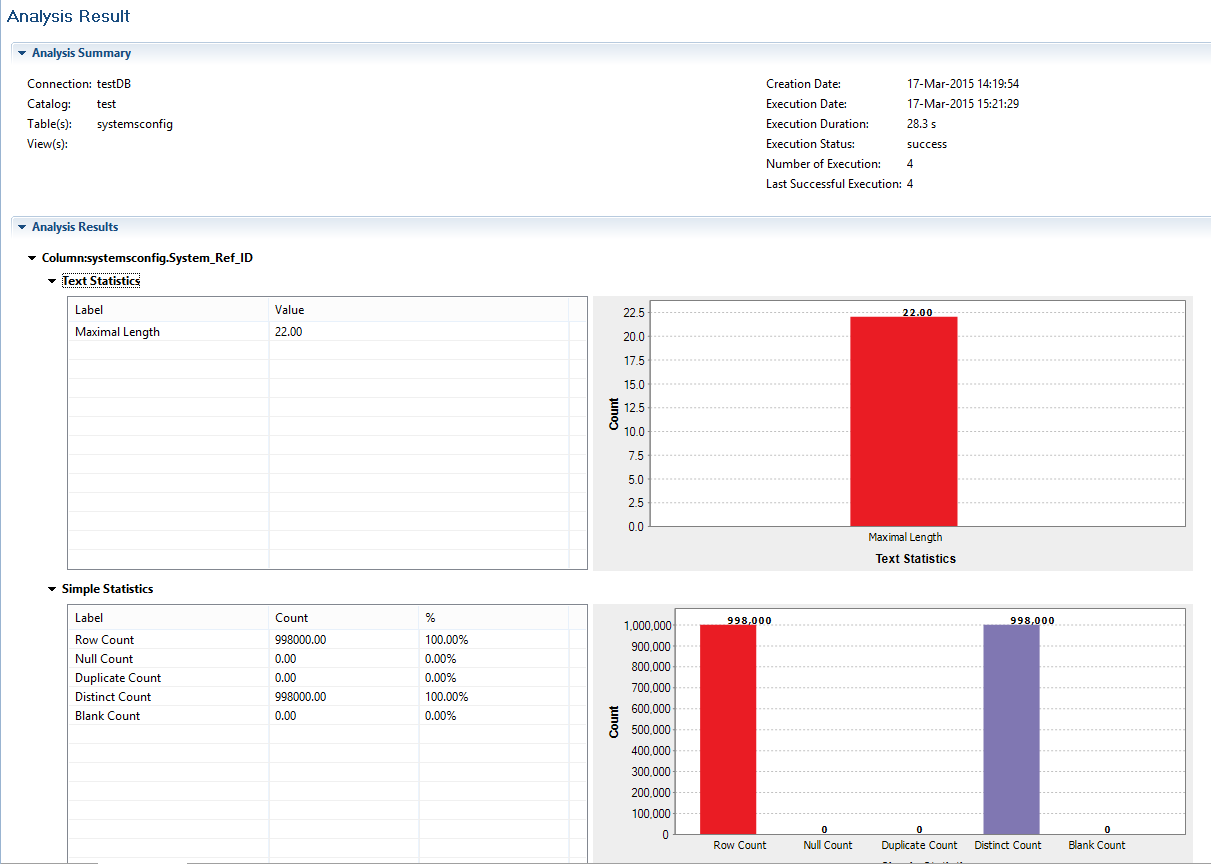
The image below indicates that all 998,000 rows are distinct. No duplicates, nulls or blanks are visible in the key column. The maximum length of the key column is 22 characters for almost a million rows, therefore we can safely assume that the key should not exceed the length of 22 characters and any necessary changes can be made to the length.
System Status
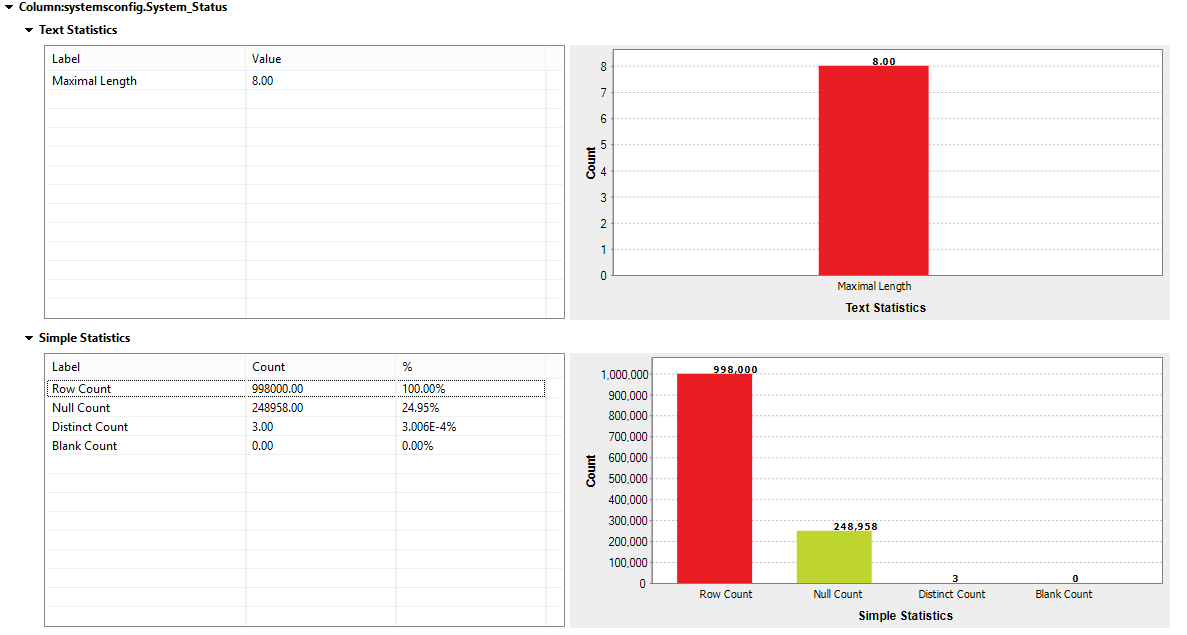
The simple analysis below reveals that 25% of the data has null values and 3 distinct values. If we cross-reference these results against our guidelines section, it is apparent that we should only have 2 distinct values and no nulls for this column.
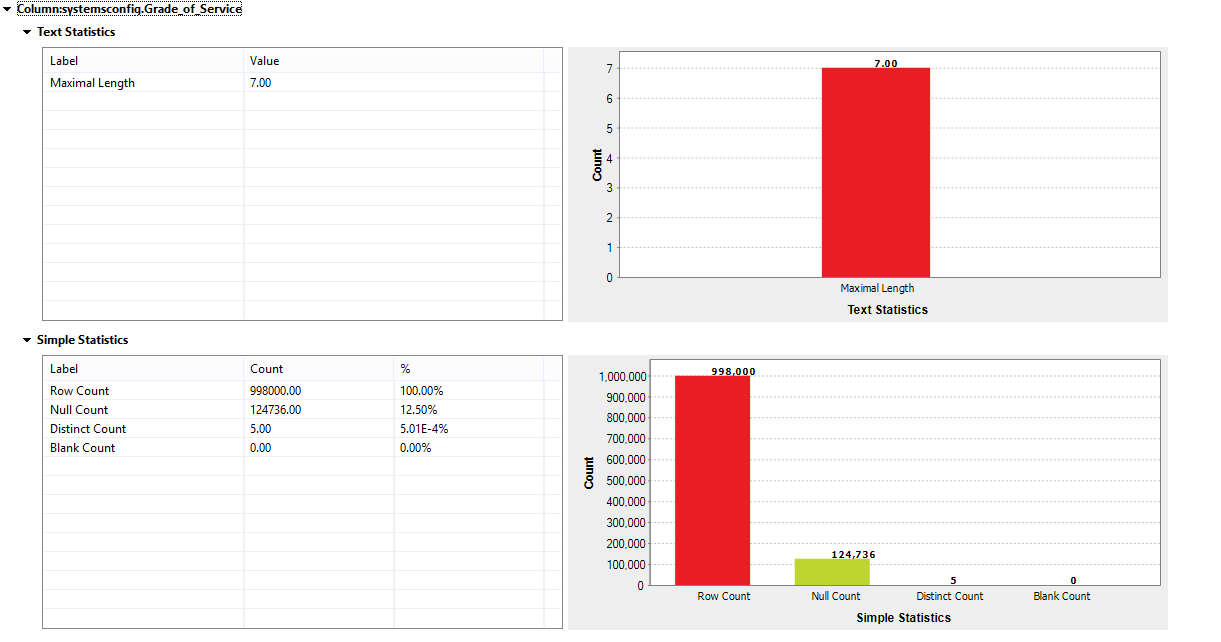
Grade of Service
The distinct count gives us a good view of the different values that are present in this column. According to the guidelines we should only have 4 values; Talend allows you to further drill down into these values and have a quick look at what the fifth value (in this case) could be. However, looking at the number of nulls in this column, the fifth value could very well be ‘null’.
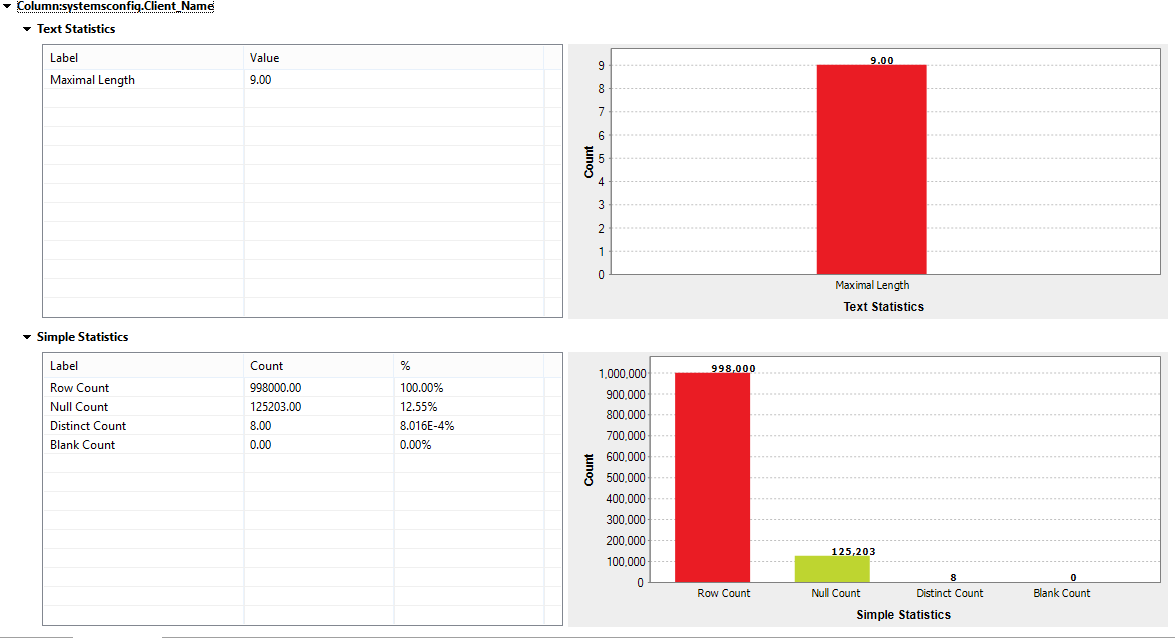
Client Name
The null values can be captured and sent to a data steward to insert the defined values or new ones. A routine can be set to determine the client name from another table based on a foreign key. The report can be re-run to include a ‘Where’ clause. This would exclude the nulls that may otherwise affect the metrics when an overall report is created.
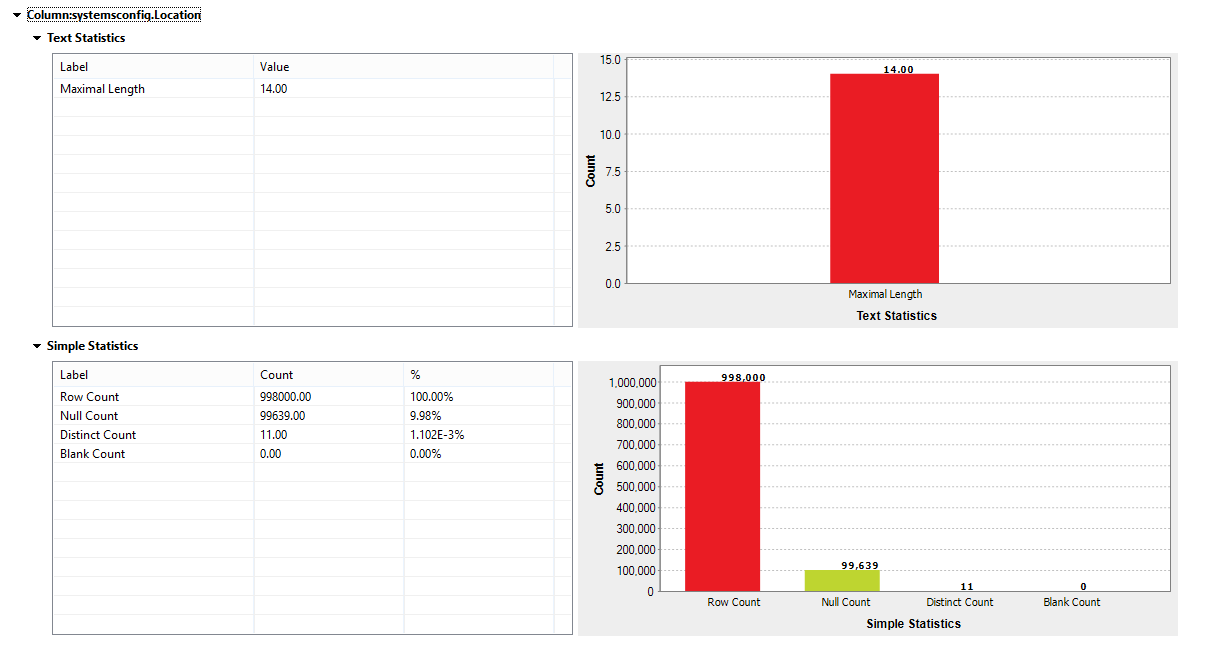
Location
The location of the server is very important as it also determines performance. Therefore, any nulls should be captured and sent to the data steward – a person responsible for the data – to be corrected.
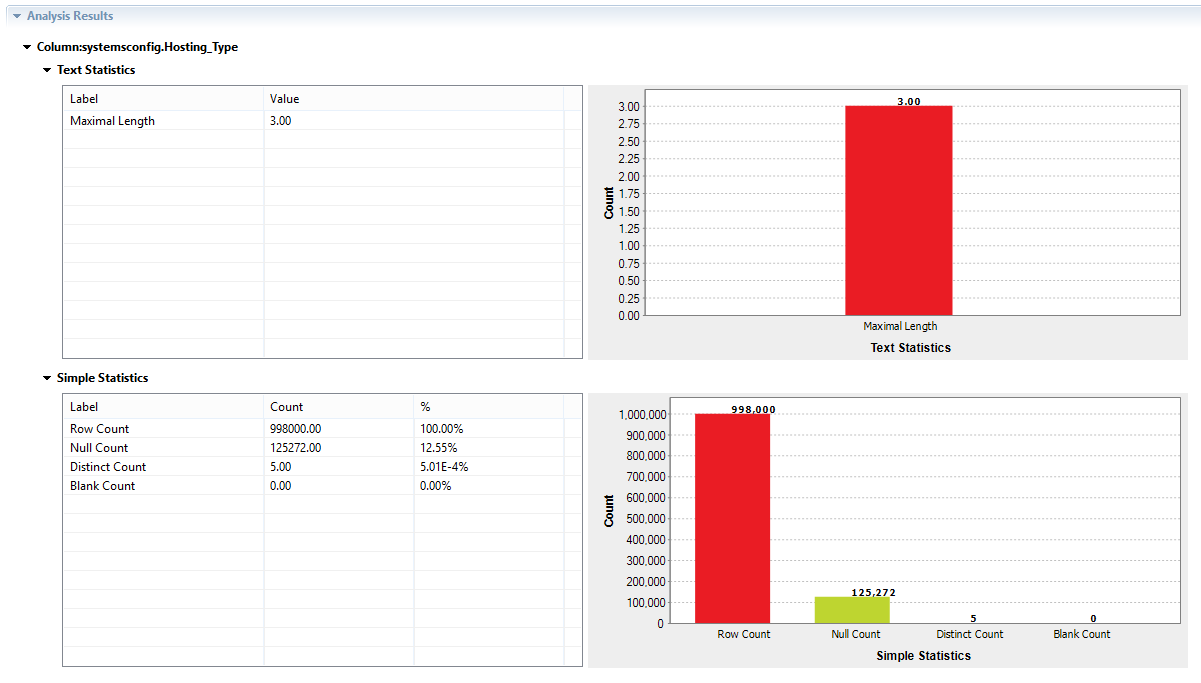
Hosting Type
The hosting type also has many null values. These null values can be captured or excluded depending on the business logic. Currently, we are only evaluating what’s in the column and what’s not and profiling the data.
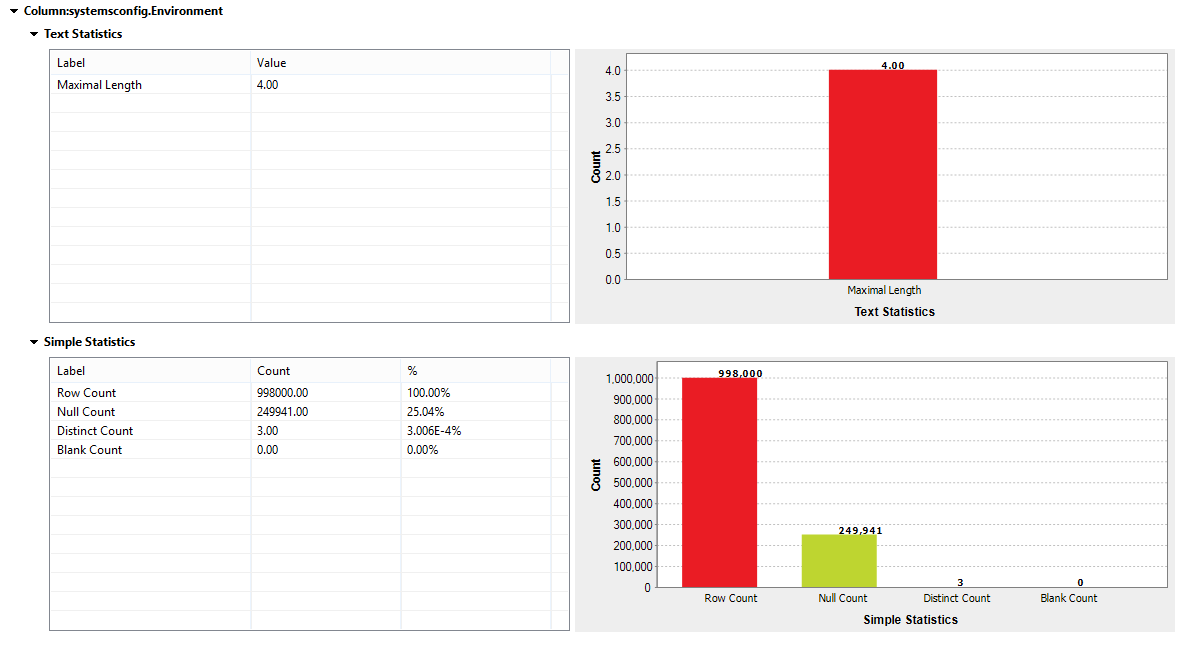
Environment
This column may be used to evaluate the development status of the servers. By drilling down, we see that the values should either be “production” or “development”. A rule can then be set to include/exclude the rows that you may want to report on. The analysis indicates a number of nulls in this column, which means that production environments could be missed whilst reporting to clients.
 Conclusion
This introduction to profiling has covered how simple statistics on a table of data can be performed to get a quick view of your data without having to code or use complex queries. Most of the queries are already generated within Talend upon selection of the user defined identifiers (UDIs). You now ought to have a clear overview of your data.
The second part of this series will explain pattern matching and how to cleanse these analysed data sets.
0 Comments
Trackbacks/Pingbacks