
Introduction
In my previous data quality blog series, part one was an introduction to Data Profiling using Talend Data Quality. It demonstrates how quickly you can connect to a data source and perform basic analysis and get an overview of the data held in your database. This is done by selecting indicators displayed on charts, such as, null counts, row counts, unique counts, etc.
Part two of the data quality series goes one step further and performs analysis on columns within a table. The analyses are based on grouping data by patterns and matching them to a set of business or industry standard rules. This helps in visualising and capturing invalid/dirty data which can then be validated and prepared for performing cleansing activities. Some of the results from pattern matching analyses, in part two of the DQ series, highlighted:
- Invalid postcodes
- Invalid phone numbers
- Invalid Email addresses
In this blog, we will use some of the data quality components in Talend Data Management Studio to demonstrate various methods of standardising and cleansing a dataset.
Data Cleansing
Data cleansing is an operation performed on databases to standardise, capture and correct invalid data. There is no such thing as 100% clean data and more often than not the need for data cleansing arises while performing meaningful analysis on data. Organisations have realised that in order to gain competitive advantage, they need to cultivate and nourish their internal data which can be used to make many important decisions.
As more and more information is made freely available over the internet and is easily accessible; a business can derive more value from their data by enriching existing data sets with external sources. However in the real world, even a monthly reporting routine may require analysts to perform some sort of standardisation or transformation of the data so that the data reported to the senior management is accurate, consistent and understandable. This can be very time consuming and reduces productivity for analysts in the front end of the business, who may spend hours cleansing the data themselves.
Data Cleansing activities can be broken down into 5 main operations:
- Profiling (Refer to part one of the DQ series)
- Standardise and match – Pattern matching (refer to part 2 of the DQ series) and standardised data adhering to business rules.
- Enrich data with external sources, such as, Experian or webservices/APIs.
- Monitor the evolving quality of data by setting up pdf reports or dashboards.
- If the quality of the data is monitored over time and data quality meets expectations, existing data cleansing jobs can be industrialised by setting up automated routines that identify data issues and cleanse source/destination systems.
Job Overview
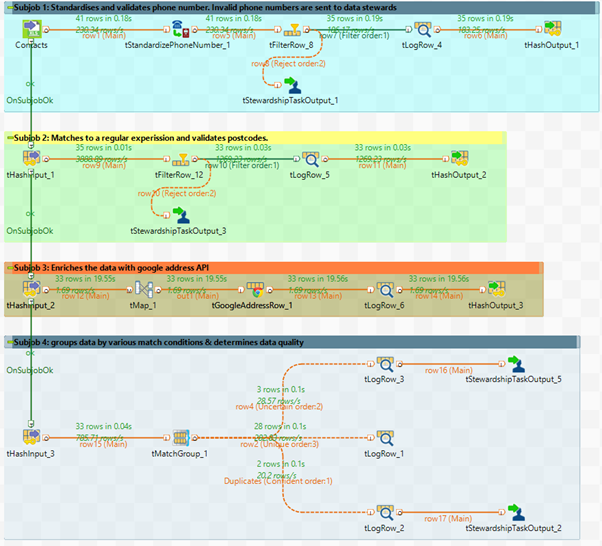
In part 2 of the DQ blog series we connected to SalesForce Contacts table. I have taken a few rows of data that can be best demonstrated from the Contacts table and saved it into an Excel workbook. The image below is an overview of a data cleansing routine in Talend. Subjob 1 standardises phone numbers. Subjob 2 uses a regular expression from part 2 of the DQ series to validate postcodes. Subjob 3 enriches the data with google address API. And Subjob 4 groups the data and determines its quality by matching records to a function.
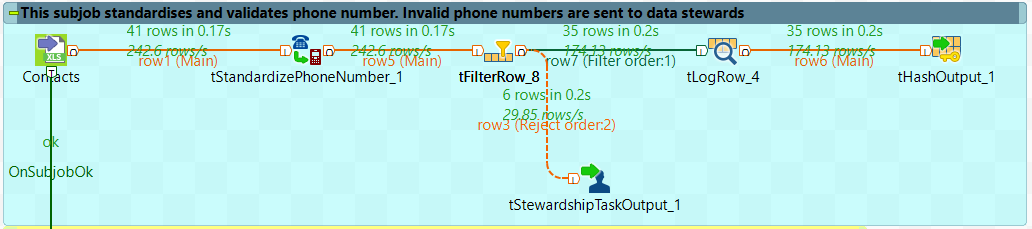
Subjob 1 – Standardise phone numbers
In this subjob we are processing raw data by standardising and validating phone numbers. As shown below, 41 rows are read from source, out of which 35 have a valid phone number and 6 rows are rejected from the main flow. The rejected rows are sent to the Talend Data Stewardship portal for data stewards to validate. The remaining 35 rows are cached and used for further processing.
| Component | Description |
|---|---|
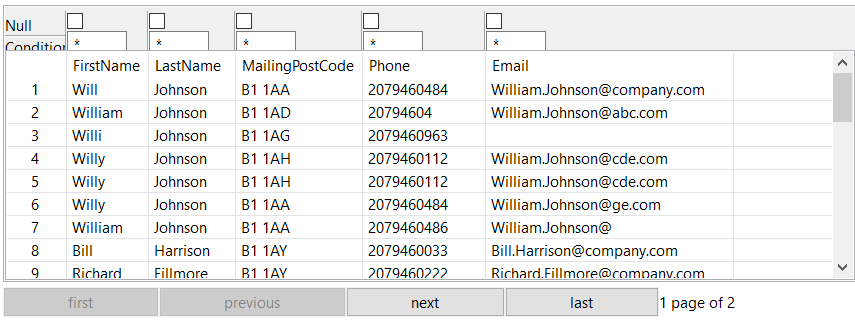
| Contacts (tFileInputExcel_02) | This component reads the data saved in an Excel file. As mentioned earlier, I have saved some of the data in Excel from the SalesForce Contacts table for the purpose of this exercise.
Data Preview: |
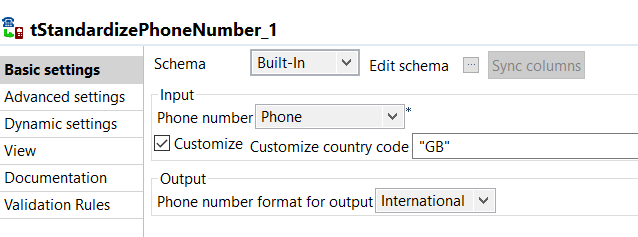
| tStandardizePhoneNumber_1 | In the image below, you can see that I have selected the Phone column from the source data as the input field. The Phone column will now be used for validation and standardisation of phone numbers. In order for Talend to recognise the country code for standardisation, I have ticked the “customize” check box and hardcoded “GB” for UK phone numbers. If unticked, the “customize” check box changes to a list box and allows you to select a country code column or a country column from your source data. You can also select which format the output should be formatted to (usually defined by the business). As shown below, I have selected the output to be formatted to “International”.
For a complete use case and a detailed understanding of the tStandardisePhoneNumber component refer to: http://www.datalytyx.com/how-to-create-a-talend-mdm-trigger-to-standardise-telephone-numbers/ |
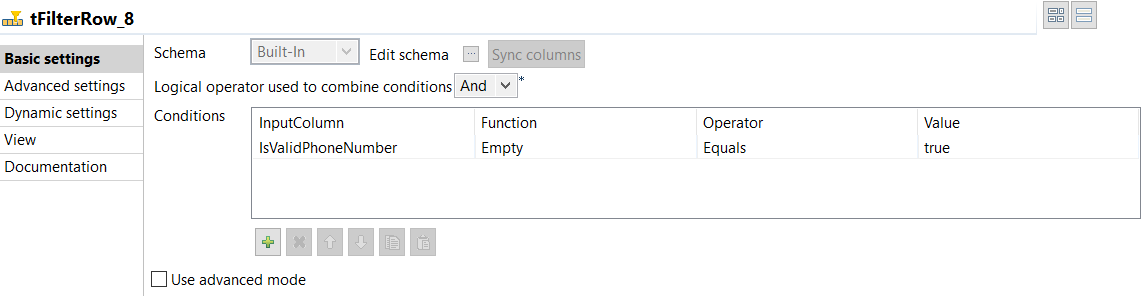
| tFilterRow_8 | In order to capture invalid phone numbers and process only validated phone numbers, I have used the tFilterRow component. As shown in the image below, the boolean field IsValidPhoneNumber is set up to filter values that are flagged as “true”.
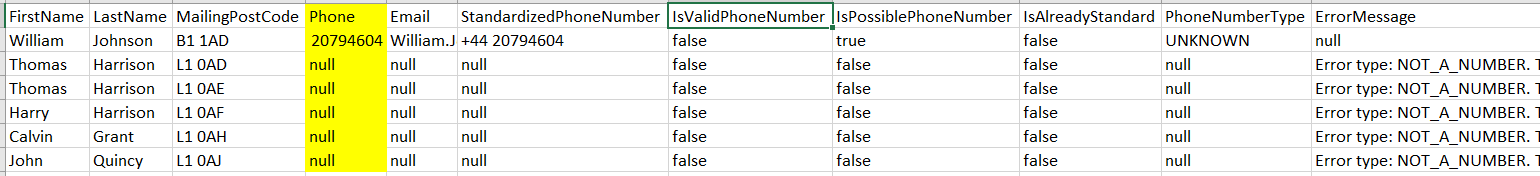
All rejected rows (invalid phone numbers highlighted in yellow below) are rejected by the tFilterRow component and created as tasks in the data stewardship portal by the tStewardshipTaskOutput_1 component in the next step.
|
| tStewardshipTaskOutput_1 | This component is used to capture rejects and create tasks in the Talend Data Stewardship portal. A data steward can then log into the portal and correct/validate values (in this case phone numbers). Once the data steward has fixed invalid data, the data can be written back to the data source using a tStewardshipTaskInput component with some integration. If you have not yet set up a data stewardship console, then the rejected rows can also be written to a csv or Excel file for manual correction, then read back in using an integration job to update the data source. |
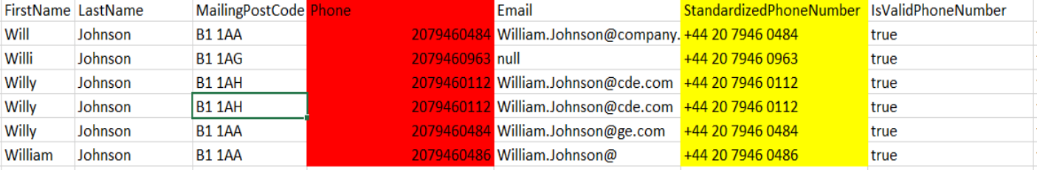
| tLogRow_4 | This component displays data in the Run console of Talend studio and is useful to monitor the data processed. The image below shows a subset of the results of the phone numbers that are standardised and are written to the tHashOutput_1 component for further processing.
The StandardizedPhoneNumber field, highlighted in yellow above, shows that valid phone numbers are now formatted and standardised as international in the output. Highlighted in red are the unformatted phone numbers at the source. |
| tHashOutput_1 | Caches data for further use. |
 The tStandardisePhoneNumber component has a set of predefined schema and processes the data by writing the results in its relevant fields. For example, once the data has been processed the standardised international format for phone numbers will be stored in the StandardizedPhoneNumber column and the Phone column (from source) will not be overwritten.
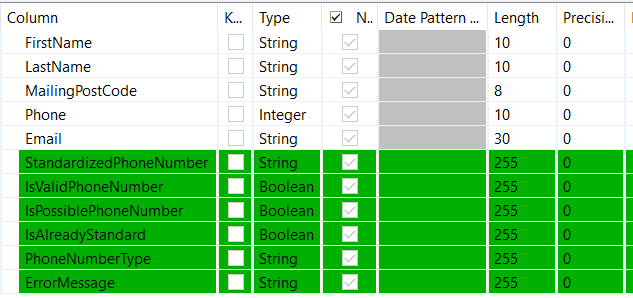
Subjob 2 – Validate Post Codes
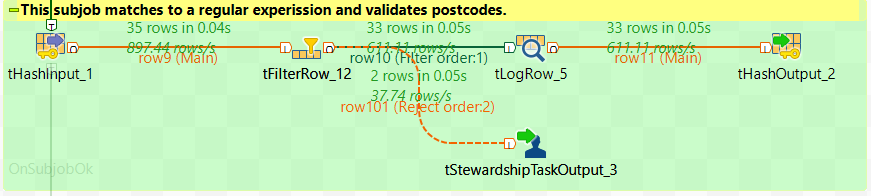
In order to validate the MailingPostCode field, we will use the same regular expression used in pattern match analysis in part 2 of the DQ series. In the subjob below, 35 rows are uncached from the previous subjob and 2 rows have rejected as they failed validation. The main flow is reduced to 33 rows and will be used for further processing.
| Component | Description |
|---|---|
| tHashInput_1 | Reads the cached data from tHashOutput_1. |
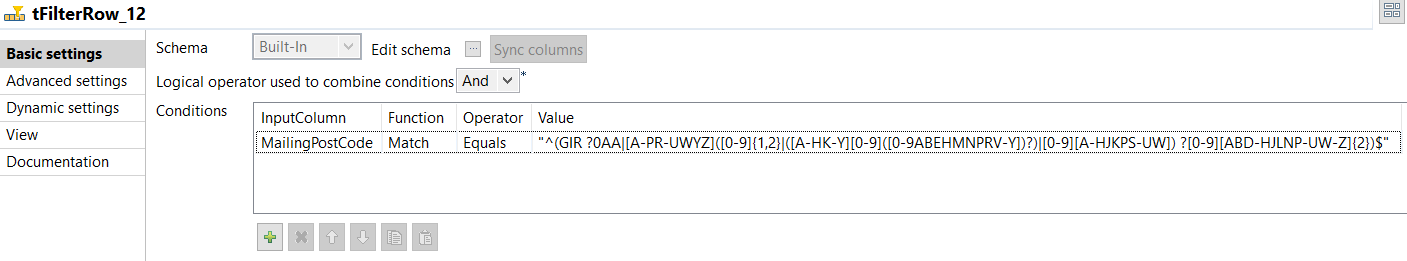
| tFilterRow_12 | The tFilterRow component is configured to filter data using a match condition (as shown below). The 2 rows that have rejected from the main flow are the ones that do not match the regular expression used and are created as new tasks in the next component.
Note: This regular expression is used to match UK postcodes only. |
| tStewardShipTaskOutput_3 | A new task will be created in the Talend Data Stewardship portal. The data stewards can then validate and correct the values for the rejected postcodes. As shown below, the 2 rows that are rejected by the match condition in the previous step appear to be incomplete or partial postcodes.
|
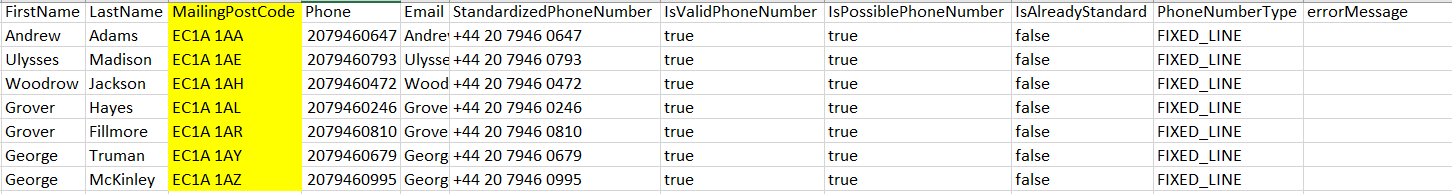
| tLogRow_5 | The image below displays some of the results from this subjob. The MailingPostCode field highlighted below, now contains valid postcodes only. Any incomplete/invalid UK postcodes would have been rejected by the tFilterRow component.
|
| tHashOutput_2 | Caches data for further use. |

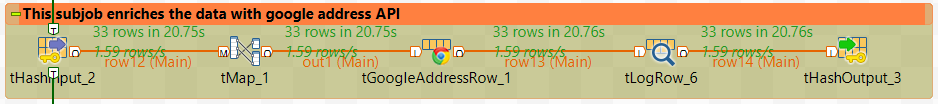
Subjob 3 – Enrich data
Using external data to enrich or validate core datasets can be very useful. Especially in this case, since I only have the post codes of my customers, the Google Address API enriches my dataset with additional address fields such as latitude, longitude, street, etc. The image below shows that all 33 rows uncached from the previous subjob are processed. In this subjob we are not performing any validation, therefore none of the rows are rejected.
| Component | Description |
|---|---|
| tHashInput_2 | Reads the cached data from tHashOutput_2. |
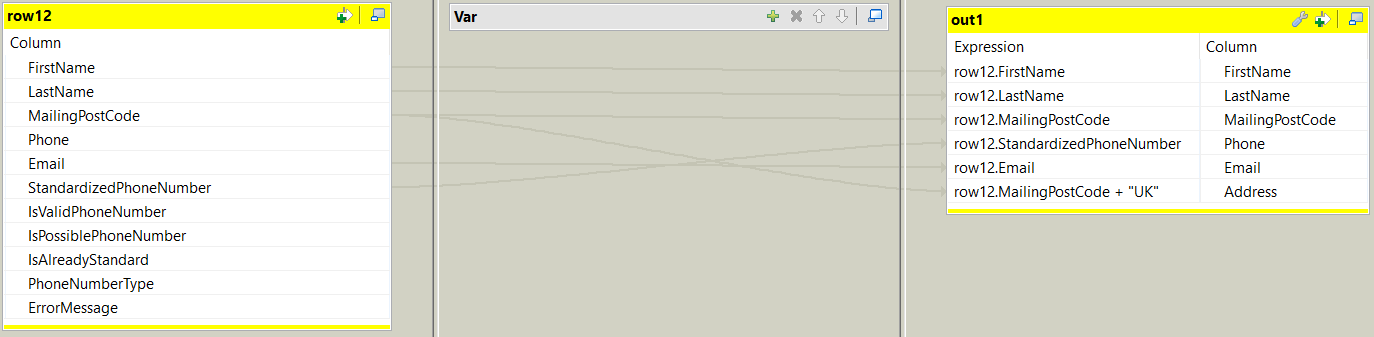
| tMap_1 | In order to get expected results from the tGoogleAddressRow component I am using a tMap to add a new column – Address. The Address column should be a concatenation of all the address fields available in your source data. Since we only have the MailingPostCode field in my data source, I have hardcoded “UK” to the MailingPostCode so that when we hit the API we only get UK addresses.
In the tMap, I have also made two other changes to the data flow:
|
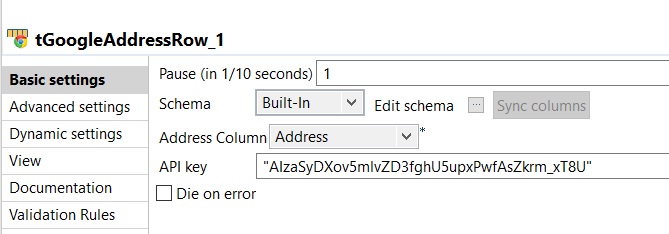
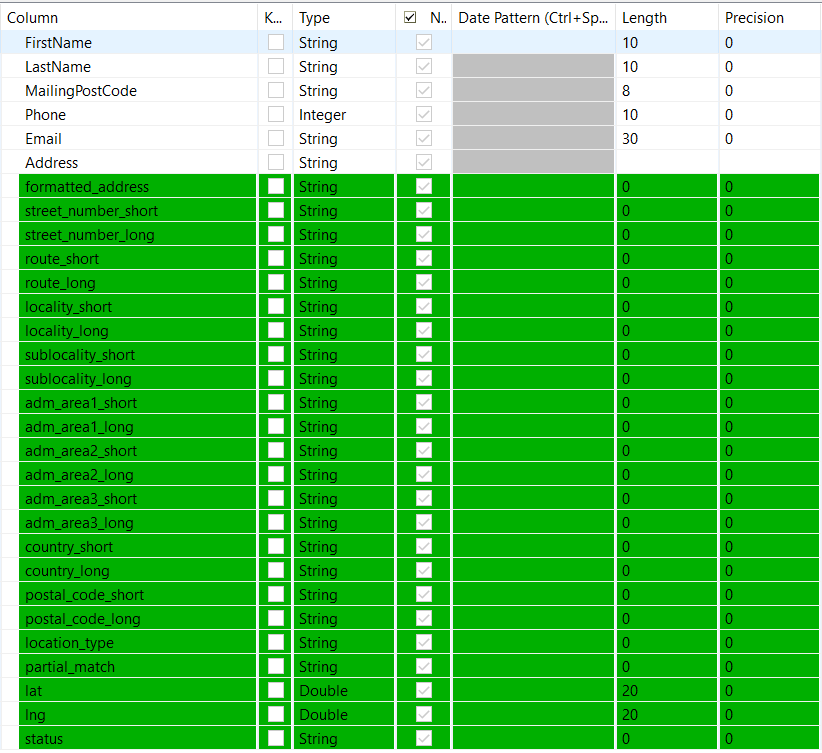
| tGoogleAddressRow_1 | In the configuration of the tGoogleAddressRow component select the Address column for the API to perform the lookup.
The tGoogleAddressRow component has it’s own schema and will update the fields (highlighted below) once it has performed the lookup using the Address column.
For a detailed setup and use case of the tGoogleAddressRow component refer to: http://www.datalytyx.com/validating-address-data-in-talend-studio/ |
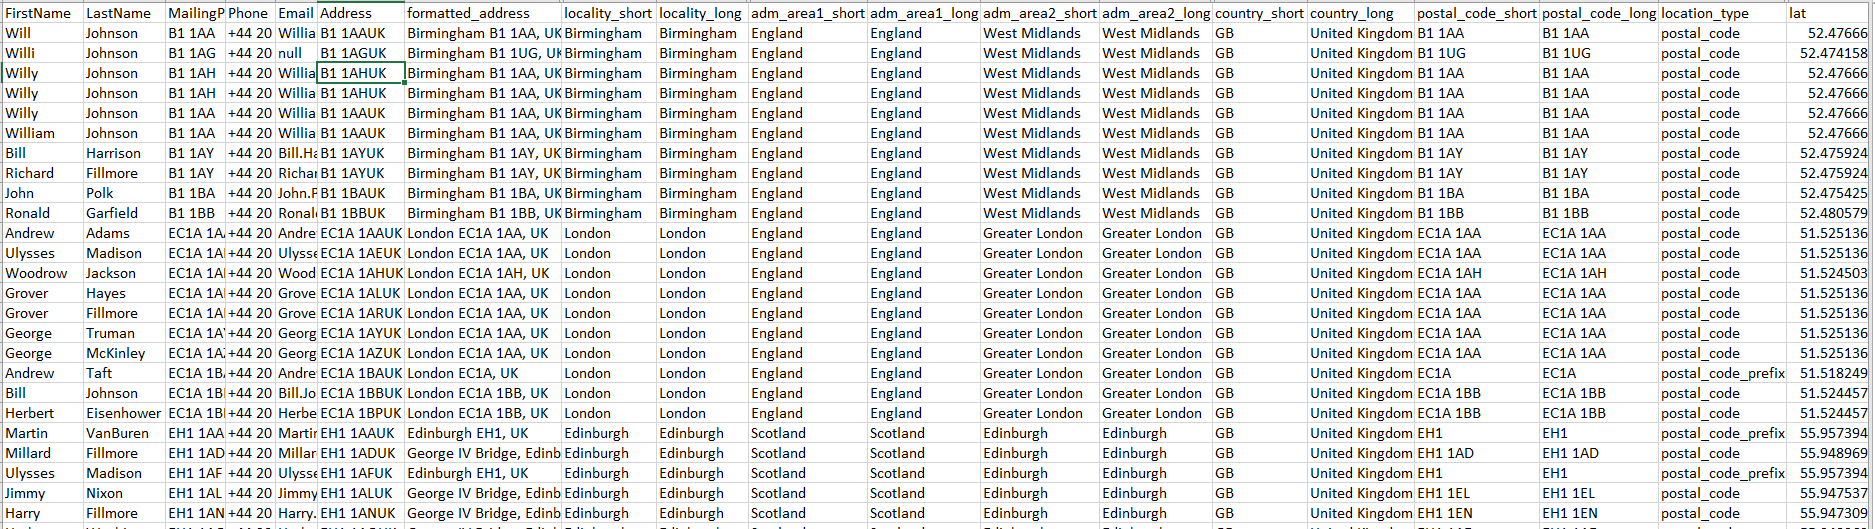
| tLogRow_6 | The image below shows the results from tGoogleAddressRow component. The Google address API used the Address column as a reference to generate the information in the other fields. We are now able to hold the address of our customers and not just their MailingPostCodes.
|
| tHashOutput_3 | Caches data for further use. |
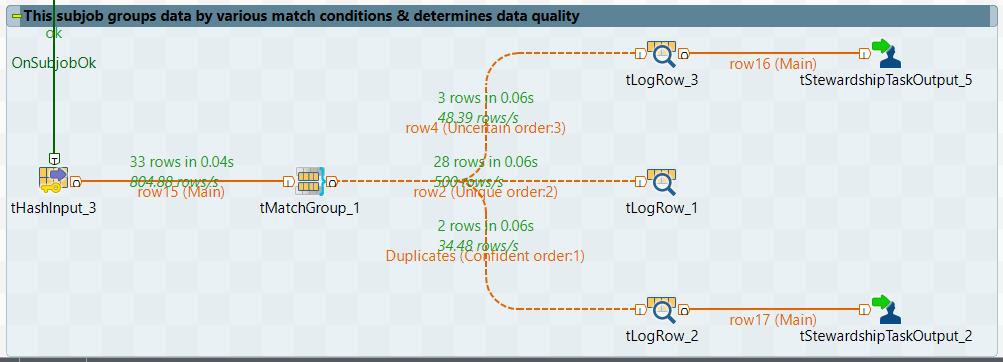
Subjob 4 – Using match methods to group data
This subjob uses tMatchGroup component to match similar data and put them into blocks or groups. These groups are given scores depending upon how identical they are. The quality of the group is determined by its matching function and weight configured in the tMatchGroup component. Matching should be performed after standardising, validation and enriching the data for best results. This way we can reduce the amount of duplicates and suspects. As shown below, 2 records are written to duplicates output, 3 records are suspected duplicates and the remaining 28 are unique.
| Component | Description |
|---|---|
| tHashInput_3 | Reads the cached data from tHashOutput_3. |
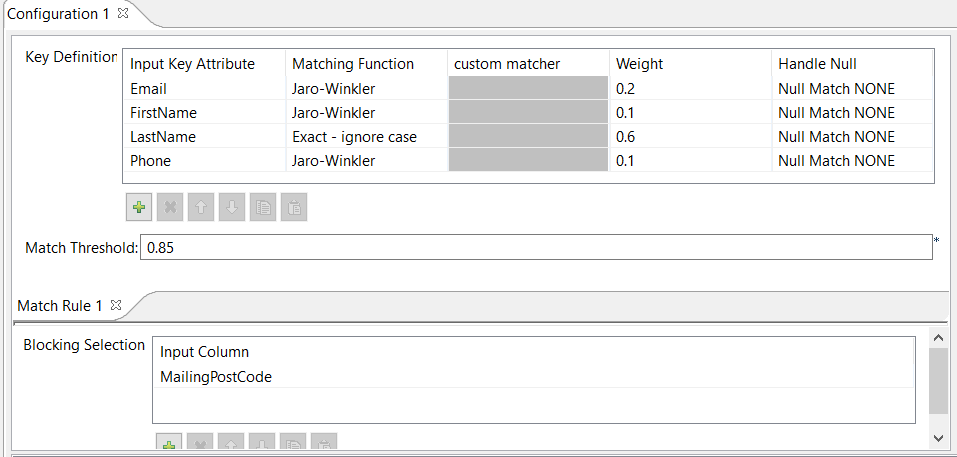
| tMatchGroup_1 | This component groups similar data by using match rules. Clicking on the preview button will take you to the configuration. I have selected some of the columns from my data and configured them to match a function, set a weight and handle null conditions. You can select a matching function, depending upon your data. I have used Jaro-Winkler to match Email, FirstName and Phone, whereas the most weighted field – LastName has been configured to perform an Exact match (not case sensitive). The Weight section will determine the overall group quality and Nullls have been configured to match none and hence ignored from the overall weighting.
In the blocking section, I have used the MailingPostCode field as the blocking key to reduce the number of pairs of records that need to be examined. It can also be used to configure multiple blocking keys while processing big data.
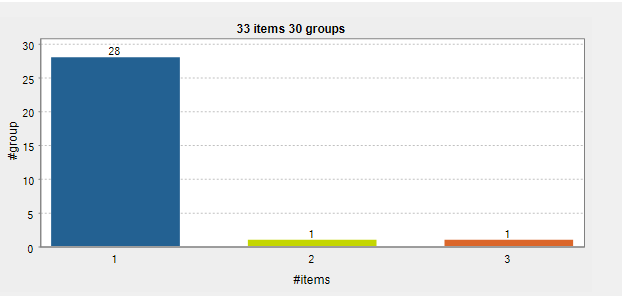
After configuring your columns and match conditions, click on the chart button and Talend will group the data and highlight the groups in different colors on a bar chart. The individual rows of grouped data will also be highlighted (as shown below).
Since the tMatchGroup component is used to check duplicate data, the output is separated into three groups –
This can be configured in the advanced section of this component, as shown below. |
| tLogRow_2 (duplicates) | In this flow, we can see the two duplicates that have been captured. The tMatchGroup component has grouped these two rows and given them a group quality score of 1 which means they are 100% identical to each other, based on the match functions configured in the previous step.
|
| tLogRow_1 (unique) | The records that are not similar to each other and cannot be grouped are written to the “unique” output from the tMatchGroup component. A different group ID is given to each record and all the records have a group size of one. |
| tLogRow_3 (uncertain) | The records that are suspected to be similar are written to this output. As shown below, the tMatchGroup component has grouped three records as suspects and given it an overall group quality of 0.97 (97%), which means that these records (based on the weighting and match functions) are 97% identical.
|
| tStewardShipTaskOutput_3 | Creates a task for data stewards to handle duplicate records captured by the tMatchGroup component. |
| tStewardShipTaskOutput_5 | Creates a task for data stewards to handle suspected records captured by the tMatchGroup component. Once the task is created, a data steward can access the data in the Data Stewardship portal and decide whether the records are identical or not. |
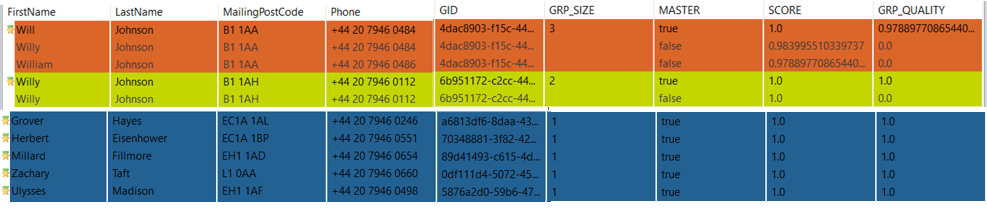 As you can see that each group has been given a group quality and score based on the weighting and match conditions configured earlier.
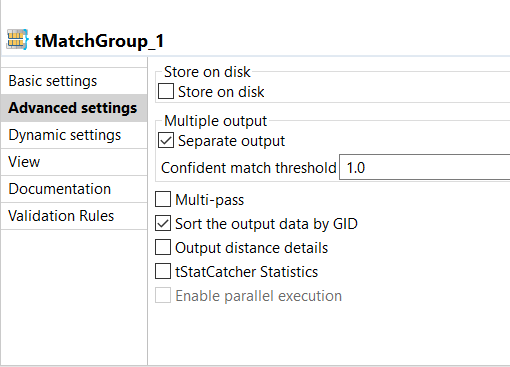


Conclusion:
In this part of the data quality series we have seen how Talend Data Management Studio can be used to build ETL jobs that can process, capture and manage dirty data. You can also create these jobs as routines to perform cleansing operations on a daily, hourly or monthly basis that can be easily set up on Talend Administration Centre, alongside other ETL jobs.
Once the jobs are running on a daily/weekly basis, data stewards can easily monitor the quality of data by setting up some key thresholds and rules around the data. Talend offers a data quality portal where measures and thresholds for DQ routines can be set up and tracked on dashboards.
You will notice the quality of data improving overtime as more and more cleansing operations are placed. These will be reflected on management reports and will be the key driver of making decisions. The next step is to manage and govern data and this can be done by the Talend MDM suite, which gives more control to business operations and lifts pressure off the IT department by empowering business users to manage changes or apply additional rules to data sets.
This brings us to the end of the data quality series where I have demonstrated the benefits of using the Talend Data management studio to profile, analyse, standardise, enrich and capture dirty data so that any decisions made from data can be accurate and trustworthy.
0 Comments