
Although the first Eurovision Song Contest (ESC) took place in 1956, one could argue that its modern era – in terms of both musical arrangements and spectacle – arrived with ABBA’s victory in Brighton in 1974. The following ESC in Sweden, 1975, was the first one to introduce the voting system still in use today[1], albeit still relying entirely on nationally appointed juries as opposed to today’s combination of jury and public voting.
The fact that this voting system, ten countries being given 12, 10, and 8 through 1 in order of preference (essentially “giving” 0 to the remaining contestants), has been used for 40 years means that good analysis can be performed on the dataset. Other than listing winners and losers and the points given to each country, biases and trends can be highlighted. Anyone that has watched at least one ESC has definitely been able to spot the unspoken alliances and regional biases. But how to support these suspicions?
I have created a visual data history of the ESC, and our analysis argues that over time, these alliances and biases have moved eastwards from western and Nordic patterns to Balkan and Russian patterns as the former Eastern bloc countries have been eligible to enter the competition.
This Tableau storyboard is available to view freely on Tableau public at the following link: Eurovision Voting History. I would encourage you to click through the dashboards alongside the rest of this article as the screenshots included in this article are intended predominantly for guidance.
Note the exclusion of the results from the semi-finals in the dataset. In 2004, these were introduced to whittle down the increasing number of entries to make for a more digestible final. While the same trends certainly lurk in these, it also introduces an unnecessary complexity to the visualisation of the ESC for the sake of this exercise.
2016 update: The results from the 2015 contest have been added to the dataset. This year had the one-time inclusion of Australia, which gave the author a minor headache when figuring out how to best include the country on the map without making them unreadable due to a zoomed out view. The solution was to simply use an inset view and place it over the vast void of Russia.
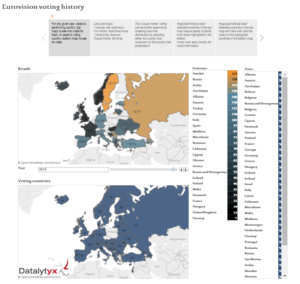
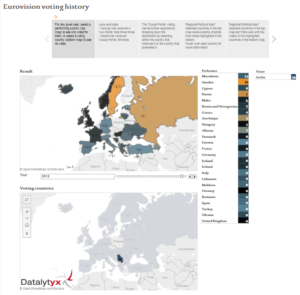
Dashboard 1: Voting history, year by year and country by country
The first dashboard is a powerful tool that visualises each year’s result, all the way back to 1975 up to 2014[2]. The year selection is located between the two map windows, and is a simple slider. When changing the year, the maps and charts update accordingly, displaying the year’s winner in yellow, and the less popular entries in darkening shades of blue.
The top map labels the country’s overall position and total points for the competition (“1 | 152”), which is also displayed in the tool tip when hovering over each country. By clicking into any participant in the ‘Result’ map, the ‘Voting countries’ and chart displays what countries voted for that particular country.
|
Overall point positioning for Sweden in 2012 (country and year selected at random) |
Countries who voted for Serbia in 2012 (country and year selected at random) |
|
|
|
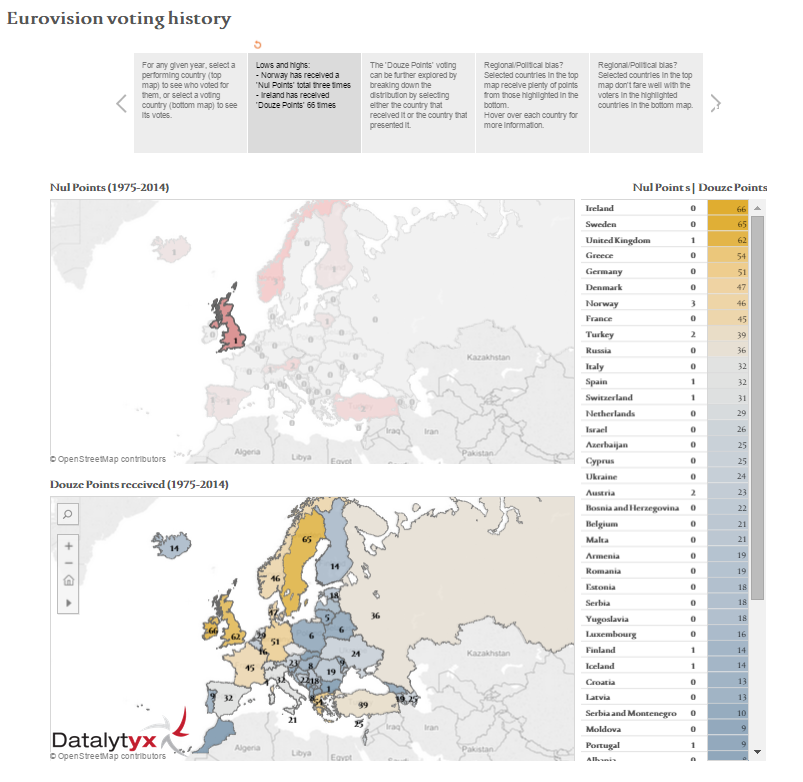
Dashboard 2: Nul and Douze Points
The concept of “Nul points” is simply a way of highlighting an especially disliked song, and there is only a handful of countries that have been “honoured” with that distinction. While getting a low result – say in the single digits – is not necessarily a sign of a better song, the songs awarded “Nul points” are most likely better remembered.
This distinction was more prevalent before the existing voting system was introduced[3], and it can be argued that in today’s even more modernised ESC with 25 countries competing in the final and a whopping 37 voting on them, getting 0 points is quite the feat, and the last time this happened was in 2003, to the United Kingdom[4].
The more positive opposite of this distinction is to be awarded the highest praise. In ESC, 12 points – affectionately called “Douze Points” – is the highest score any voting country gives out, and the bottom map highlights the countries with the biggest collection of them. Ireland, Sweden, and the United Kingdom are all in the sixties, and almost every country has received 12 points at least once. The exceptions are San Marino (who only just performed in their first final in 2014) and Morocco, an oddity that hasn’t returned to compete since its one entry in 1980 (scoring only seven points from Italy). There are two countries that have yet to reach the ESC final – Andorra and the Czech Republic – that still have been able to vote in it, and while we’re on the subject it is worth mentioning that Kosovo has yet to either perform or vote.
|
The United Kingdom has only suffered nul point in once in the history of ESC (country selected at random) |
Sweden’s winning streak puts them in second overall place (country selected at random) |
|
|
|

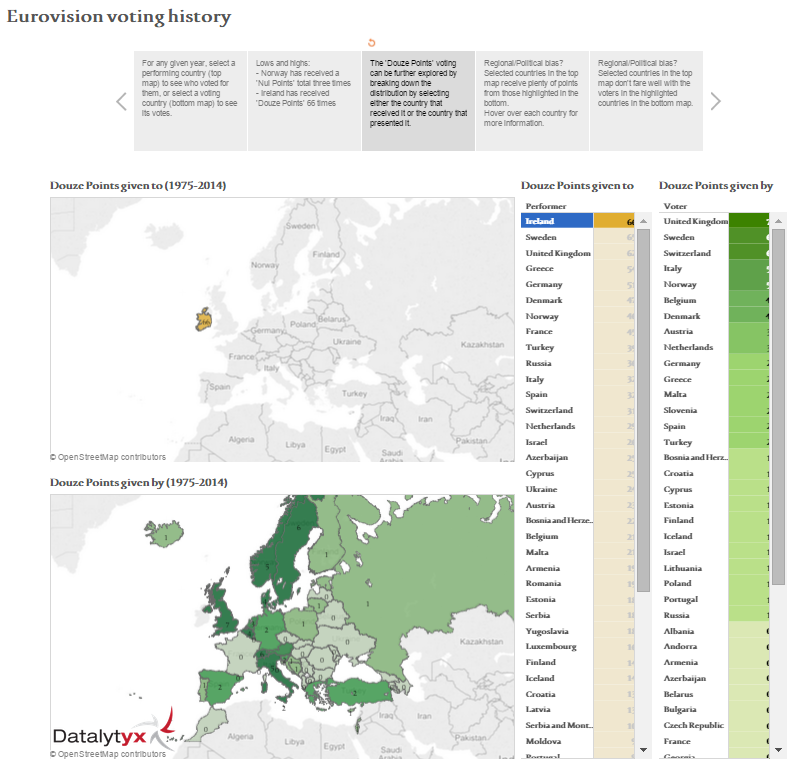
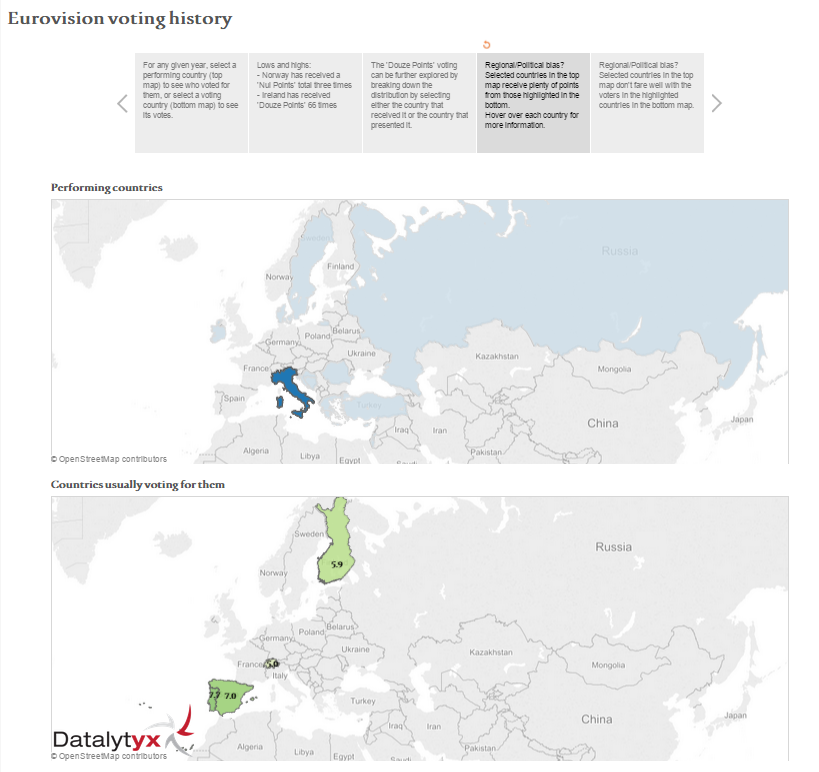
Dashboard 3: A closer look into Douze Points
This dashboard lets you drill down to see who gave the performing countries 12 points, but also whom each country has given them to. It serves as a nice warm-up and introduction to the voting biases presented in the next two dashboards.
For example, Ireland’s total of 66 individual high scores has come from a pretty spread out selection although the United Kingdom has given them the most, as may be expected. Note that of the countries with the biggest history in the ESC, France seems to not ‘warm to’ Ireland at all, at least not enough to award them 12 points even once.
So what’s this about biases? Well, let’s look at Russia. None of its 12-pointers come from the west, and most of them from the former Eastern bloc. The same is true for Ukraine, Belarus, and Azerbaijan. There are exceptions in more westernised countries like Estonia and Latvia, where the countries in the Baltic area can favour them. Likewise, the Nordic countries, including Finland, routinely hand out 12-pointers to each other.
As with the first dashboard, you can click into the voters to see where their 12-pointers have been assigned to further analyse these biases.
|
Most of the Eurovision voting participants appear to be a fan of Ireland (country selected at random) |
Russia’s relies on its eastern block neighbours for a favourable outcome (country selected at random) |
|
|
|

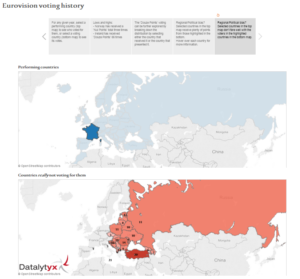
Dashboard 4: Regional/Political bias?

This scatterplot forms the basis for this dashboard, and will further highlight the rampant voting biases in the ESC. The plot is calculated using a performing country’s average points and the total points given to a specific country by a voter. The juicy part is the top right quadrant, and a set was created by picking out a selection where the average points received was over 5, and the total points received was over a 100. This removes highlights in the top left quadrant that are yet to become trends[5], leaving only consistent voting patterns. To illustrate this voting pattern, let’s see what that top right outlier is all about. Enhance!

Well, look at that. When Cyprus votes for Greece, you can pre-fill your score sheet with the first digit 1 for 10 or 12 points. A shocking 11.2 point average really highlights this neighbourly bias, and the circle to its left cements it: Greece gives Cyprus 10.3 points on average. Not to be outdone, the two circles below are two countries – neighbours – both voting for Sweden. Denmark dishes out a 7.9 average, and Norway a 7.1 average.
The further down we go on the scatterplot, the harder it gets to read, so let’s visualise it. Click on Cyprus and see that the only country seemingly voting for them is Greece. Make of that what you want. Select Greece, and you’ll see that its closest neighbours also vote for them. Likewise, Sweden can always trust its Nordic neighbours for those important high scoring votes.
Russia, as we saw on the Douze Points dashboard, gets its votes from the neighbours as well. Perhaps most remarkably, Italy gets points not only from Alpine and Mediterranean neighbours, but also… Finland?
|
Greece and Cyprus are looking after their own (countries selected at random) |
Italy has some surprising and shy fans in Finland (country selected at random) |
|
|
|
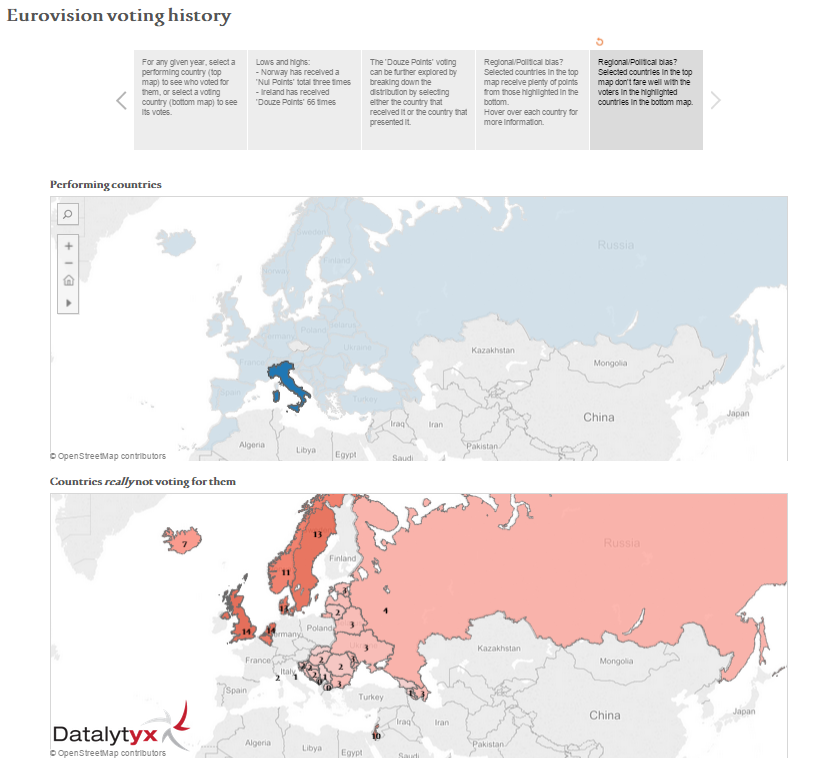
Dashboard 5: Regional/Political bias?
Another regression analysis, this time highlighting countries that tend to not vote for certain other countries. The most interesting entries in the graph are of course along the bottom and a selection was made where the total average points a voting country has given to each performing country is below 6, including a total overall where the given points for all contests is below 50. This creates a set highlighting which countries can be perceived to have little regard for each other, be it for political reasons or otherwise.

Here are some notable insight to illustrate what exactly this dashboard shows
- Spain and Portugal: Sweden has only voted for Spain 7 out of 39 times, suggesting Swedes visit the Balearics and Canaries for the sun, not for the music. Additionally, most of Eastern Europe do not vote for the Spanish entry, nor do they vote for its Iberian neighbour, Portugal, a sentiment shared by almost all of the rest of Europe.
- Russia, Ukraine and Belarus: Perhaps unsurprisingly, these entries don’t get much love from the West. Belarus especially has been roughly introduced to its four first contests in the ESC.
- Gemany and Sweden: No votes from the East, but also not many votes from Greece. Something to do with being fed up with sun tourists from those countries? Further drilling down investigation would uncover patterns.
- United Kingdom: Again, a Western country getting no votes from the East. Or Iceland.
- Norway: More liked in the East than in the western Mediterranean.
- Finland: With a penchant for singing in its little understood native tongue[6], Finland has not surprisingly been looked at with bewilderment the West – the Netherlands having voted for them only 3 out of 30 times. Perhaps a little more surprisingly, its Urgric language brother Hungary has only voted once out of 8 times for them, though that might have more to do with Finland by them singing in English.
- The Balkan countries (including Yugoslavia): Has never quite caught on in the West.
|
Eastern Europe doesn’t appear to be fans of the Spanish entries (country selected at random) |
Northern Europe doesn’t give much sentiment to the Italian entries (country selected at random) |
|
|
|
Combinations!
These combinations may not be too obvious at first, but by selecting different scenarios over the different dashboards, the map visualisation helps in highlighting some interesting patterns:
- France and Turkey: France has given Turkey 12 points 7 times, but has received 20 zeroes and no 12 points in return!
- Iceland and the Mediterranean: Seldom voted for by the warmer countries in the south, Iceland is just as cold in return to Turkey, Greece, and Italy. Cyprus, an island cousin, while not maybe liked, at least is not as disliked.
So, by using a dataset containing the voting data from the past forty years and putting it into a visualisation that is easy to interpret, one can actually see the patterns and trends that some people state exist in the Eurovision Song Contest. This story dashboard focuses on the biased voting highlights, but the data invites further investigation.
For now, we recommend anticipating Cyprus giving 12 points to Greece… If they both make it to the final, that is!
[1] The ESCs before it had all used at least three different voting systems.
[2] Note that Yugoslavia and Serbia & Montenegro have both competed in the ESC, but don’t exist as countries anymore. They are however selectable on the map. Just hover over the small dots on the Balkans and you’ll find them (if they competed in the selected year).
[3] For example, in each of the four ESCs between 1962 and 1965 four countries were awarded 0 points.
[4] Some countries have been close, like France in 2014 (2 points), Ireland in 2007 and 2013 (both times 5 points).
[5] The fact that Albania has received 12 points from Italy the one time Italy could vote for them (the top left circle) is not quite a trend yet.
[6] Albeit following the native language rule imposed by the ESC, changed in 1998 to allow any language.
0 Comments
Trackbacks/Pingbacks